
| Synonyms | |
| Status | |
| Molecule Category | Free-form |
| UNII | H4C81M8YYW |
| EPA CompTox | DTXSID00144539 |
Structure
| InChI Key | BATCTBJIJJEPHM-UHFFFAOYSA-N |
|---|---|
| Smiles | |
| InChI |
|
Physicochemical Descriptors
| Property Name | Value |
|---|---|
| Molecular Formula | C23H20F3N5O2 |
| Molecular Weight | 455.44 |
| AlogP | 5.39 |
| Hydrogen Bond Acceptor | 5.0 |
| Hydrogen Bond Donor | 1.0 |
| Number of Rotational Bond | 4.0 |
| Polar Surface Area | 80.24 |
| Molecular species | NEUTRAL |
| Aromatic Rings | 3.0 |
| Heavy Atoms | 33.0 |
Pharmacology
| Mechanism of Action | Action | Reference |
|---|---|---|
| Anandamide amidohydrolase inhibitor | INHIBITOR | ClinicalTrials PubMed PubMed |
 Homo sapiens
 Rattus norvegicus
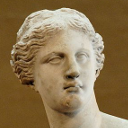
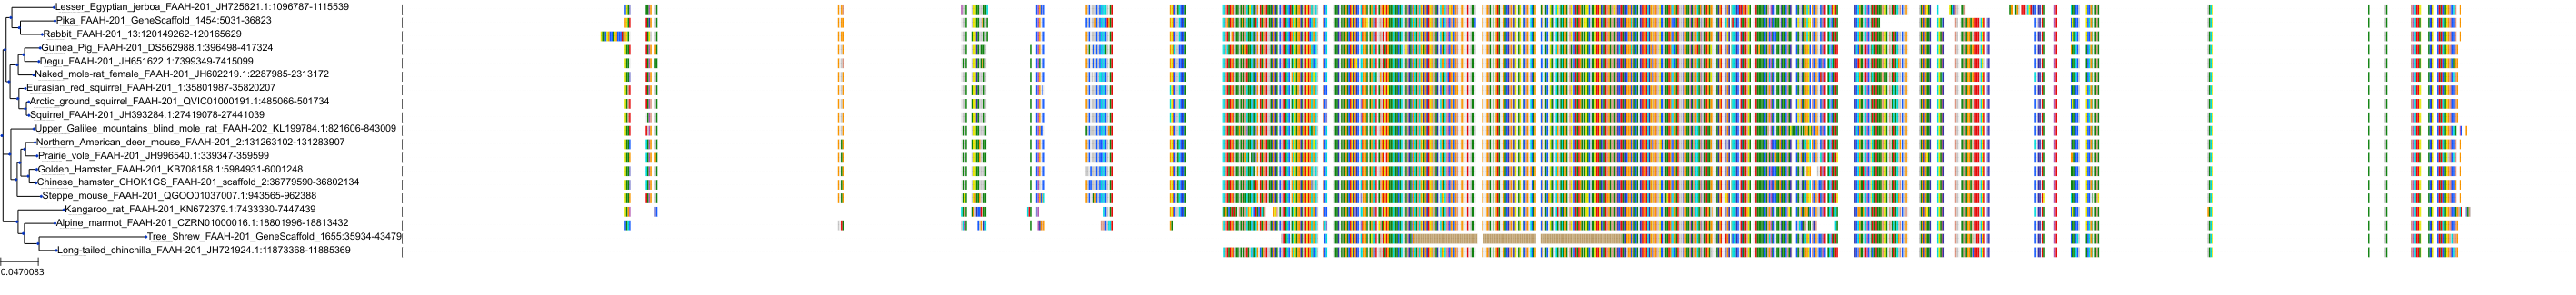
Target Conservation
|
Protein: Anandamide amidohydrolase Description: Fatty-acid amide hydrolase 1 Organism : Homo sapiens O00519 ENSG00000117480 |
|
|||


Cross References
| Resources | Reference |
|---|---|
| CAS NUMBER | 1020315-31-4 |
| ChEMBL | CHEMBL1651534 |
| DrugBank | DB12012 |
| FDA SRS | H4C81M8YYW |
| Guide to Pharmacology | 6694 |
| PubChem | 24771824 |
| SureChEMBL | SCHEMBL1010408 |
| ZINC | ZINC000066111849 |
CONTENTS
